Strategy
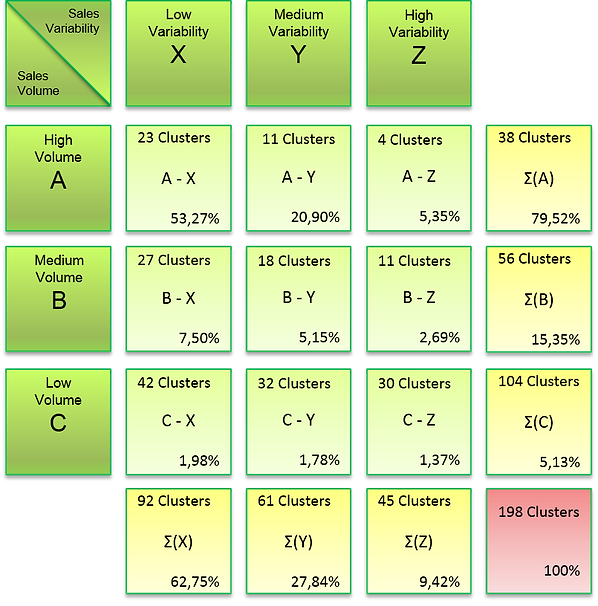
In order to optimize the supply chain's global inventory levels, the first step is understanding which products have a greater impact on the company's activity and from those, which inventory and stock levels must be optimized. Using an ABC-XYZ matrix analysis, it's possible to aggregate products according to their Sales volume and variability.
Having the group of product clusters chosen, in other words, a quadrant of the matrix, it's important to obtain their Real Demand, Forecast Values, Coverage Times and Lead Times (from both, a material's (MLT) and a production's (PLT) requirements.
Using Unicer's Safety Stock calculation strategy, it's possible to calculate the Aggregate Existing Stock and Remaining Stock.

From this point onward, the first step towards a more adaptive Safety Stock calculations is the division of the fixed Coverage Time in 12 equal Monthly Coverage Times (MCT).
Then, running Microsoft Excel's Goal Seek for each time period of every product, a set of preductions is obtained, in order to achieve, firstly, the desired Remainder (0,00%) and in a second run, the objective of Service Level (99,00%).

Once this analysis is complete, one observes a certain degree of incoherence. In order to increase the plausibility and adequacy of the results, two filters are applied. The first, takes into consideration user inputs, limiting the result reductions within certain bounds.
Then, from the 30 time periods of the analysis, a translation to 12 monthly reductions is acquired selecting the minimum among the analogous months' reductions.
Because the Goal Seek Analysis results provide results disregarding the company's production restrictions, a factor - Company Lead Time - is used to represent said limitations, being decomposable in two components:
-
Material Lead Time - Time interval from the material's ordering and reception.
-
Production Lead Time - Required amount of waitng time between two consecutive production orders.
To add value to the results presented until now, the traditional Safety Stock calculation method is introduced as an additional input for the model's final result.

The proposed Stock Management methodology, can be structured as a mathematical model with the following flow chart representation.

On the diagram, it's visible that CT, CLT, MCT and SSAlt act as inputs for the final stage of the methodology, which is a comparison sequence among these four terms. That sequence is visible below, where X stands for the solution space composed of MCT and SSAlt (CT and CLT are the result bounds).

Schedule

Difficulties
In a past paced industrial activity, such as the one under study, people are occupied by a constant stream of tasks. Finding the time to contribute towards a side project can be a challenging endeavour, leading to an increase in difficulty when gathering data.
Unlike obtaining data or knowledge from a human source, historical data records are much easier to obtain, however, the automatic recording leads to less verifications, enabling the possibility of incorrect records.
To overcome these difficulties, a great anticipation had to be put into scheduling meetings, in order to take advantage of every opportunity with a professional with the knowledge to answer my doubts.